Illuminant Estimation for Color Constancy:
Why spatial domain methods work and the role of the color distribution
Dongliang Cheng
Dilip K. Prasad
Michael S. Brown
|
Abstract:
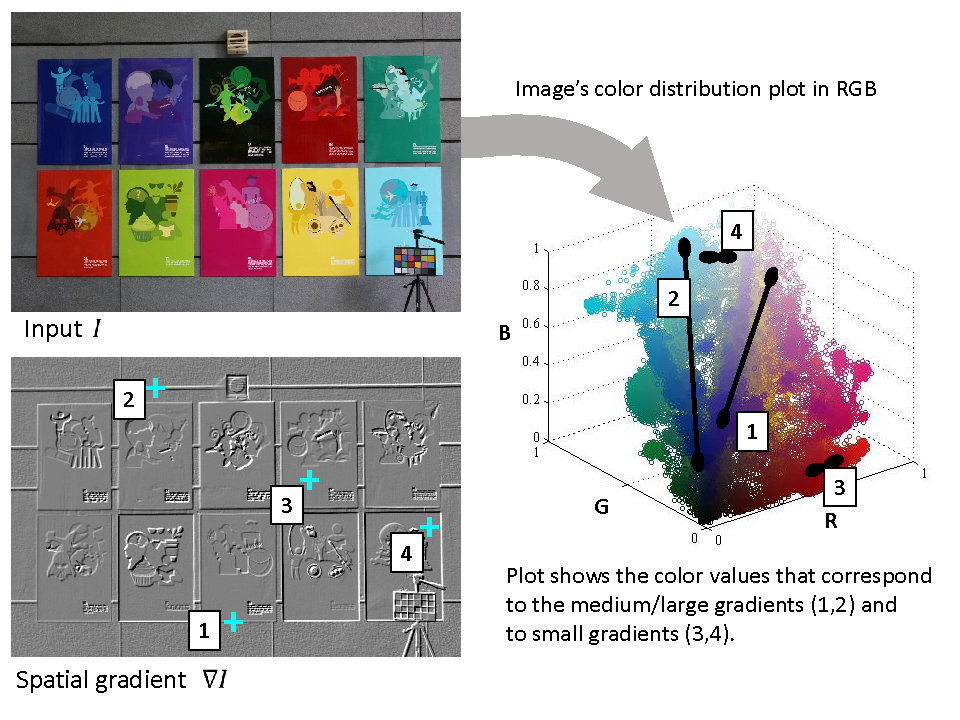
Color constancy is a well studied topic in color vision. Methods are generally categorized as: 1) low-level statistical methods; 2) gamut-based methods; 3) and learning-based methods. In this work, we distinguish methods depending on whether they work directly from color values (i.e. color domain) or from values obtained from the image spatial information (e.g. image gradients/frequencies). We show that spatial information does not provide any additional information that cannot be obtained directly from the color distributions and that the indirect aim of spatial domain methods is to obtain large color differences for estimating the illumination direction. This finding allowed us to develop a simple and efficient illumination estimation method that chooses bright and dark pixels using a projection distance in the color distribution and then applies PCA to estimate the illumination direction. Our method gives state-of-the-art results on existing public illumination datasets as well as on our newly collected dataset containing 1736 images from 8 different cameras.
|
Results on existing Datasets:
Re-processed Version of Color Checker Database from Shi and Funt
| METHOD |
MEAN |
MEDIAN |
TRIMEAN |
BEST 25% |
WORST 25% |
MAX |
| Proposed (3.5%) |
3.52 |
2.14 |
2.47 |
0.50 |
8.74 |
28.35 |
| Gray-World |
6.36 |
6.28 |
6.28 |
2.33 |
10.58 |
24.83 |
| White-Patch |
7.55 |
5.68 |
6.35 |
1.45 |
16.12 |
40.58 |
| Shades-of-Gray (p=4) |
4.93 |
4.01 |
4.23 |
1.14 |
10.20 |
22.40 |
| General Gray-World(p=9, σ=9) |
4.66 |
3.48 |
3.81 |
1.00 |
10.09 |
22.04 |
| 1st-order Gray-Edge(p=1, σ=6) |
5.33 |
4.52 |
4.73 |
1.86 |
10.03 |
26.35 |
| 2nd-order Gray-Edge(p=1, σ=1) |
5.13 |
4.44 |
4.62 |
2.11 |
9.26 |
23.88 |
| Bright Pixels (p=2, 2%) |
3.98 |
2.61 |
- |
- |
- |
- |
| Pixel-based Gamut(σ=4) |
4.20 |
2.33 |
2.91 |
0.50 |
10.72 |
23.18 |
| Edge-based Gamut(σ=4) |
6.52 |
5.04 |
5.43 |
1.90 |
13.58 |
28.99 |
| Intersection-based Gamut(σ=9) |
4.20 |
2.39 |
2.93 |
0.51 |
10.70 |
24.22 |
| Bayesian |
4.82 |
3.46 |
3.88 |
1.26 |
10.49 |
24.48 |
| Spatio-spectral (ML) |
3.67 |
2.96 |
3.10 |
0.95 |
7.61 |
21.58 |
| Spatio-spectral (GenPrior) |
3.59 |
2.96 |
3.10 |
0.95 |
7.61 |
21.58 |
| Natural Image Statistics |
4.19 |
3.13 |
3.45 |
1.00 |
9.22 |
26.20 |
| Bottom-up+Top-down |
3.48 |
2.47 |
2.61 |
0.84 |
8.01 |
25.22 |
Note:
* All static methods are reported using the best results from the several parameters tested (same in the following tables)
* Any algorithm that requires learning is trained and tested using a three-fold cross-validation as used in others' experiment (same in the following tables)
* Best 25% error is the mean of the smallest 25% error values (same in the following tables)
* Worst 25% error is the mean of the highest 25% error values (same in the following tables)
* All other methods results collected from colorconstancy.com
|
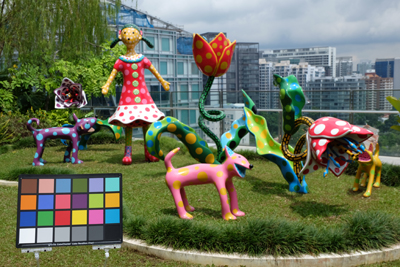
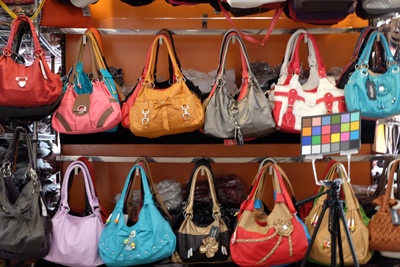
Newly Collected Datasets:
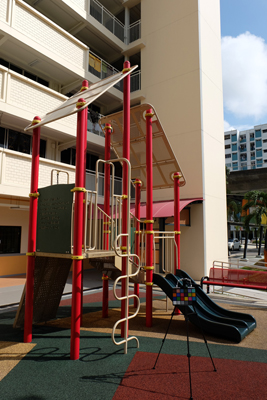
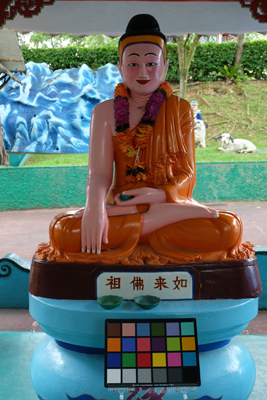
For our own collected image datasets from 9 different cameras, some example scenes of the datasets are shown below.
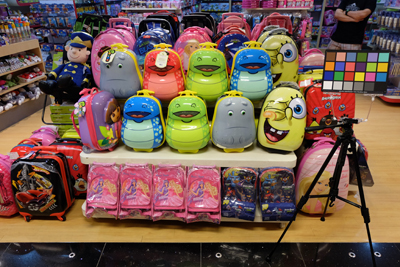 |
 |
 |
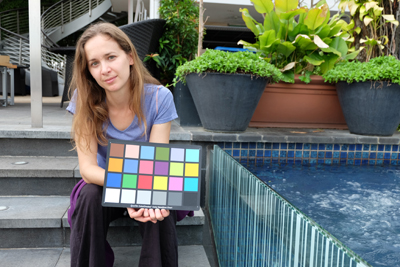 |
The data is available in three formats: (1) camera-specific RAW format free of any manipulation, (2) DCRAW-converted linear images which can be read and used directly, as well as (3) camera JPEG outputs for the purpose of viewing the image content. In order to get original linear raw data, DCRAW command line arguments '-D -4 -T' was used. No further demosaicing was done, but only downsampling according to camera's bayer pattern to create a color image. To be noted, care had been taken for the Fujifilm X-M1 camera, which has a novel 6*6 bayer pattern. For each image, co-ordinates for the color-checker inside the image are also provided, as well as small region masks for every color patch. The ground truth illuminants were obtained from the difference of the two most brightest achromatic patches containing no saturated value to get rid of the effects from the dark level and saturation level of the sensor. In order to use those images, dark level has to be subtracted from the original images, which is provided in the ground truth .mat file.
Datesets and results are divided according to the cameras: (click on the camera name to see the according results)
And another extra camera with smaller number of images is also provided here:
* For more information about these data, please refer to README.
** For a complementary indoor Laboratory images set,
here.
|
Results on our newly collected Datasets (click on "proposed" to download our results):
| METHOD |
MEAN |
MEDIAN |
TRIMEAN |
BEST 25% |
WORST 25% |
MAX |
| Proposed (0.5%) |
2.93 |
2.01 |
2.22 |
0.59 |
6.82 |
16.20 |
| Gray-World |
5.16 |
4.15 |
4.46 |
0.95 |
11.00 |
22.37 |
| White-Patch |
7.99 |
6.19 |
6.98 |
1.56 |
16.75 |
39.12 |
| Shades-of-Gray (p=3) |
3.81 |
2.73 |
3.06 |
0.66 |
8.52 |
15.74 |
| General Gray-World(p=1, σ=9) |
3.16 |
2.35 |
2.50 |
0.64 |
7.08 |
16.72 |
| 1st-order Gray-Edge(p=3, σ=6) |
3.45 |
2.48 |
2.74 |
0.81 |
7.69 |
17.69 |
| 2nd-order Gray-Edge(p=9, σ=9) |
3.47 |
2.44 |
2.70 |
0.86 |
7.76 |
15.73 |
| Bright Pixels (p=2, 3%) |
3.37 |
2.45 |
2.67 |
0.62 |
7.82 |
18.87 |
| Pixel-based Gamut(σ=10) |
6.13 |
4.30 |
4.81 |
1.05 |
14.16 |
29.09 |
| Edge-based Gamut(σ=7) |
6.07 |
4.68 |
4.87 |
1.38 |
13.35 |
33.59 |
| Intersection-based Gamut(σ=9) |
6.37 |
4.72 |
5.13 |
1.18 |
14.47 |
28.96 |
| Bayesian |
3.58 |
2.80 |
2.97 |
0.76 |
7.95 |
13.54 |
| Spatio-spectral (ML) |
3.58 |
2.80 |
2.97 |
0.76 |
7.95 |
13.54 |
| Spatio-spectral (GenPrior) |
3.21 |
2.67 |
2.79 |
0.88 |
6.43 |
16.62 |
| Natural Image Statistics |
4.18 |
3.04 |
3.30 |
0.78 |
9.51 |
21.43 |
| METHOD |
MEAN |
MEDIAN |
TRIMEAN |
BEST 25% |
WORST 25% |
MAX |
| Proposed (2%) |
2.81 |
1.89 |
2.12 |
0.55 |
6.50 |
17.33 |
| Gray-World |
3.89 |
2.88 |
3.07 |
0.83 |
8.53 |
15.93 |
| White-Patch |
10.96 |
12.44 |
11.40 |
2.03 |
18.75 |
22.76 |
| Shades-of-Gray(p=3) |
3.23 |
2.58 |
2.63 |
0.64 |
7.06 |
15.08 |
| General Gray-World(p=3, σ=9) |
3.24 |
2.28 |
2.41 |
0.63 |
7.58 |
18.38 |
| 1st-order Gray-Edge(p=9, σ=3) |
3.22 |
2.07 |
2.36 |
0.73 |
7.48 |
17.86 |
| 2nd-order Gray-Edge(p=3, σ=3) |
3.21 |
2.29 |
2.37 |
0.80 |
7.41 |
17.68 |
| Bright Pixels (p=4, 3%) |
3.15 |
2.48 |
2.47 |
0.67 |
7.22 |
17.56 |
| Pixel-based Gamut(σ=8) |
14.51 |
14.83 |
14.78 |
9.98 |
18.45 |
22.54 |
| Edge-based Gamut(σ=10) |
15.36 |
15.92 |
15.73 |
11.23 |
18.66 |
22.48 |
| Intersection-based Gamut(σ=9) |
14.46 |
14.72 |
14.80 |
10.02 |
18.29 |
22.59 |
| Bayesian |
3.29 |
2.35 |
2.40 |
0.69 |
7.93 |
15.60 |
| Spatio-spectral (ML) |
2.80 |
2.32 |
2.37 |
0.72 |
5.99 |
15.43 |
| Spatio-spectral (GenPrior) |
2.67 |
2.03 |
2.18 |
0.68 |
5.77 |
15.54 |
| Natural Image Statistics |
3.43 |
2.46 |
2.72 |
0.78 |
7.76 |
20.16 |
| METHOD |
MEAN |
MEDIAN |
TRIMEAN |
BEST 25% |
WORST 25% |
MAX |
| Proposed (2.5%) |
3.15 |
2.15 |
2.41 |
0.65 |
7.30 |
21.16 |
| Gray-World |
4.16 |
3.30 |
3.40 |
0.91 |
9.04 |
21.06 |
| White-Patch |
10.20 |
10.59 |
10.25 |
1.82 |
18.26 |
25.10 |
| Shades-of-Gray (p=3) |
3.56 |
2.81 |
2.93 |
0.87 |
7.55 |
18.55 |
| General Gray-World (p=3, σ=9) |
3.42 |
2.60 |
2.72 |
0.73 |
7.62 |
20.83 |
| 1st-order Gray-Edge(p=3, σ=3) |
3.13 |
1.99 |
2.26 |
0.72 |
7.32 |
22.79 |
| 2nd-order Gray-Edge(p=3, σ=3) |
3.12 |
2.00 |
2.27 |
0.70 |
7.23 |
24.44 |
| Bright Pixels(p=4, 3%) |
3.48 |
2.67 |
2.82 |
0.76 |
7.68 |
21.45 |
| Pixel-based Gamut(σ=10) |
8.59 |
8.87 |
8.64 |
3.44 |
13.40 |
21.73 |
| Edge-based Gamut(σ=10) |
7.76 |
8.02 |
7.70 |
2.30 |
13.44 |
21.89 |
| Intersection-based Gamut(σ=10) |
6.80 |
5.90 |
6.19 |
2.18 |
12.51 |
19.68 |
| Bayesian |
3.98 |
3.20 |
3.33 |
0.93 |
8.82 |
18.32 |
| Spatio-spectral (ML) |
3.12 |
2.70 |
2.69 |
0.75 |
6.93 |
18.75 |
| Spatio-spectral (GenPrior) |
2.99 |
2.45 |
2.55 |
0.81 |
5.99 |
15.07 |
| Natural Image Statistics |
4.05 |
2.96 |
3.06 |
0.86 |
9.37 |
28.54 |
| METHOD |
MEAN |
MEDIAN |
TRIMEAN |
BEST 25% |
WORST 25% |
MAX |
| Proposed (3%) |
2.90 |
2.08 |
2.19 |
0.56 |
6.73 |
15.50 |
| Gray-World |
4.38 |
3.39 |
3.59 |
0.92 |
9.69 |
20.61 |
| White-Patch |
11.64 |
11.67 |
11.53 |
1.77 |
21.89 |
53.08 |
| Shades-of-Gray (p=3) |
3.45 |
2.56 |
2.74 |
0.72 |
7.69 |
15.53 |
| General Gray-World(p=3, σ=9) |
3.26 |
2.31 |
2.49 |
0.63 |
7.53 |
15.54 |
| 1st-order Gray-Edge(p=3, σ=3) |
3.37 |
2.22 |
2.52 |
0.79 |
8.42 |
23.57 |
| 2nd-order Gray-Edge(p=9, σ=3) |
3.47 |
2.19 |
2.58 |
0.73 |
8.21 |
24.33 |
| Bright Pixels (p=4, 3%) |
3.07 |
2.30 |
2.44 |
0.59 |
7.01 |
15.61 |
| Pixel-based Gamut(σ=8) |
10.14 |
10.32 |
10.25 |
4.35 |
15.93 |
33.72 |
| Edge-based Gamut(σ=3) |
13.00 |
12.24 |
11.75 |
3.92 |
24.33 |
60.87 |
| Intersection-based Gamut(σ=8) |
9.67 |
9.24 |
9.35 |
4.05 |
16.18 |
33.73 |
| Bayesian |
3.97 |
3.10 |
3.36 |
0.92 |
8.18 |
17.85 |
| Spatio-spectral (ML) |
3.22 |
2.43 |
2.59 |
0.91 |
6.88 |
17.65 |
| Spatio-spectral (GenPrior) |
3.15 |
2.26 |
2.49 |
0.86 |
6.90 |
16.63 |
| Natural Image Statistics |
4.10 |
2.40 |
2.77 |
0.74 |
10.01 |
56.44 |
| METHOD |
MEAN |
MEDIAN |
TRIMEAN |
BEST 25% |
WORST 25% |
MAX |
| Proposed (0.5%) |
2.76 |
1.87 |
2.05 |
0.55 |
6.31 |
23.28 |
| Gray-World |
3.44 |
2.58 |
2.73 |
0.85 |
7.41 |
16.46 |
| White-Patch |
9.78 |
9.50 |
9.54 |
1.65 |
18.58 |
25.11 |
| Shades-of-Gray (p=9) |
3.16 |
2.42 |
2.59 |
0.76 |
6.78 |
16.99 |
| General Gray-World(p=1, σ=1) |
3.08 |
2.15 |
2.35 |
0.72 |
6.69 |
22.20 |
| 1st-order Gray-Edge(p=3, σ=1) |
3.02 |
2.11 |
2.26 |
0.65 |
6.88 |
20.57 |
| 2nd-order Gray-Edge(p=3, σ=1) |
2.84 |
2.18 |
2.20 |
0.71 |
6.47 |
19.58 |
| Bright Pixels (p=2, 3%) |
2.91 |
2.18 |
2.36 |
0.63 |
6.30 |
18.11 |
| Pixel-based Gamut(σ=9) |
6.52 |
4.39 |
4.79 |
1.42 |
15.42 |
18.85 |
| Edge-based Gamut(σ=10) |
13.20 |
8.55 |
10.88 |
1.55 |
30.21 |
53.56 |
| Intersection-based Gamut(σ=9) |
6.21 |
4.11 |
4.63 |
1.38 |
14.41 |
34.03 |
| Bayesian |
3.75 |
2.81 |
3.00 |
0.91 |
8.19 |
22.22 |
| Spatio-spectral (ML) |
2.92 |
2.24 |
2.34 |
0.86 |
6.09 |
15.14 |
| Spatio-spectral (GenPrior) |
2.86 |
2.21 |
2.28 |
0.78 |
6.14 |
14.21 |
| Natural Image Statistics |
3.22 |
2.17 |
2.42 |
0.76 |
7.46 |
16.53 |
| METHOD |
MEAN |
MEDIAN |
TRIMEAN |
BEST 25% |
WORST 25% |
MAX |
| Proposed (3.5%) |
2.96 |
2.02 |
2.31 |
0.67 |
6.66 |
16.59 |
| Gray-World |
3.82 |
3.06 |
3.15 |
0.82 |
8.45 |
16.74 |
| White-Patch |
13.41 |
18.00 |
14.98 |
2.25 |
20.40 |
23.89 |
| Shades-of-Gray (p=9) |
3.22 |
2.30 |
2.48 |
0.78 |
7.12 |
18.47 |
| General Gray-World(p=1, σ=1) |
3.12 |
2.23 |
2.45 |
0.70 |
6.86 |
17.61 |
| 1st-order Gray-Edge(p=1, σ=1) |
2.99 |
2.16 |
2.25 |
0.56 |
7.03 |
21.15 |
| 2nd-order Gray-Edge(p=3, σ=1) |
2.99 |
2.04 |
2.26 |
0.61 |
6.86 |
20.03 |
| Bright Pixels (p=1, 5%) |
3.05 |
2.15 |
2.30 |
0.66 |
6.95 |
17.97 |
| Pixel-based Gamut(σ=10) |
6.00 |
4.74 |
4.98 |
2.06 |
12.19 |
26.91 |
| Edge-based Gamut(σ=10) |
5.78 |
4.85 |
5.09 |
1.76 |
11.38 |
52.08 |
| Intersection-based Gamut(σ=10) |
5.28 |
4.23 |
4.49 |
1.54 |
10.70 |
24.75 |
| Bayesian |
3.41 |
2.41 |
2.58 |
0.68 |
8.00 |
19.51 |
| Spatio-spectral (ML) |
2.93 |
2.28 |
2.44 |
0.84 |
6.07 |
15.29 |
| Spatio-spectral (GenPrior) |
2.85 |
2.22 |
2.37 |
0.82 |
5.90 |
14.54 |
| Natural Image Statistics |
3.70 |
2.28 |
2.67 |
0.79 |
8.74 |
21.34 |
| METHOD |
MEAN |
MEDIAN |
TRIMEAN |
BEST 25% |
WORST 25% |
MAX |
| Proposed (3%) |
2.91 |
2.03 |
2.22 |
0.66 |
6.48 |
15.52 |
| Gray-World |
3.90 |
3.00 |
3.15 |
0.81 |
8.51 |
17.32 |
| White-Patch |
11.97 |
12.99 |
12.45 |
2.59 |
20.23 |
23.99 |
| Shades-of-Gray (p=9) |
3.17 |
2.33 |
2.45 |
0.78 |
6.92 |
13.80 |
| General Gray-World(p=1, σ=1) |
3.22 |
2.57 |
2.66 |
0.77 |
6.85 |
12.41 |
| 1st-order Gray-Edge(p=1, σ=1) |
3.09 |
2.23 |
2.32 |
0.71 |
7.00 |
20.90 |
| 2nd-order Gray-Edge(p=9, σ=3) |
3.18 |
2.32 |
2.41 |
0.74 |
7.23 |
20.85 |
| Bright Pixels (p=4, 3%) |
3.13 |
2.49 |
2.64 |
0.81 |
6.57 |
14.11 |
| Pixel-based Gamut(σ=10) |
7.74 |
7.91 |
7.70 |
2.65 |
13.01 |
18.09 |
| Edge-based Gamut(σ=4) |
8.06 |
6.12 |
6.56 |
3.00 |
16.27 |
29.40 |
| Intersection-based Gamut(σ=10) |
6.80 |
6.37 |
6.40 |
2.25 |
11.98 |
18.35 |
| Bayesian |
3.98 |
3.00 |
3.27 |
0.93 |
8.62 |
18.12 |
| Spatio-spectral (ML) |
3.11 |
2.51 |
2.63 |
0.80 |
6.46 |
15.76 |
| Spatio-spectral (GenPrior) |
2.94 |
2.29 |
2.44 |
0.75 |
6.22 |
14.04 |
| Natural Image Statistics |
3.66 |
2.77 |
2.94 |
0.75 |
8.16 |
15.25 |
| METHOD |
MEAN |
MEDIAN |
TRIMEAN |
BEST 25% |
WORST 25% |
MAX |
| Proposed (1%) |
2.93 |
2.33 |
2.42 |
0.78 |
6.13 |
12.39 |
| Gray-World |
4.59 |
3.46 |
3.81 |
1.16 |
9.85 |
17.84 |
| White-Patch |
9.91 |
7.44 |
8.78 |
1.44 |
21.27 |
39.78 |
| Shades-of-Gray (p=3) |
3.67 |
2.94 |
3.03 |
0.98 |
7.75 |
13.79 |
| General Gray-World(p=1, σ=9) |
3.20 |
2.56 |
2.68 |
0.85 |
6.68 |
17.89 |
| 1st-order Gray-Edge(p=9, σ=9) |
3.35 |
2.58 |
2.76 |
0.79 |
7.18 |
15.04 |
| 2nd-order Gray-Edge(p=3, σ=3) |
3.36 |
2.70 |
2.80 |
0.89 |
7.14 |
15.78 |
| Bright Pixels (p=2, 3%) |
3.24 |
2.62 |
2.73 |
0.81 |
6.78 |
12.94 |
| Pixel-based Gamut(σ=7) |
5.27 |
4.26 |
4.45 |
1.28 |
11.16 |
50.45 |
| Edge-based Gamut(σ=8) |
4.40 |
3.30 |
3.45 |
0.99 |
9.83 |
32.70 |
| Intersection-based Gamut(σ=7) |
5.32 |
3.81 |
4.13 |
1.11 |
11.93 |
50.42 |
| Bayesian |
3.50 |
2.36 |
2.57 |
0.78 |
8.02 |
18.05 |
| Spatio-spectral (ML) |
3.24 |
2.70 |
2.82 |
0.93 |
6.55 |
15.63 |
| Spatio-spectral (GenPrior) |
3.06 |
2.58 |
2.74 |
0.87 |
6.17 |
14.78 |
| Natural Image Statistics |
3.45 |
2.88 |
2.95 |
0.83 |
7.18 |
12.96 |
| METHOD |
MEAN |
MEDIAN |
TRIMEAN |
BEST 25% |
WORST 25% |
MAX |
| Proposed (3.5%) |
3.81 |
2.72 |
3.10 |
0.95 |
8.07 |
17.20 |
| Gray-World |
4.60 |
3.44 |
3.69 |
0.98 |
10.06 |
18.35 |
| White-Patch |
12.75 |
15.32 |
13.80 |
3.69 |
19.78 |
22.91 |
| Shades-of-Gray (p=3) |
3.93 |
3.24 |
3.38 |
1.11 |
7.98 |
18.65 |
| General Gray-World(p=3, σ=1) |
4.04 |
2.92 |
3.22 |
1.07 |
8.39 |
18.24 |
| 1st-order Gray-Edge(p=3, σ=9) |
3.94 |
2.99 |
3.33 |
0.88 |
8.72 |
15.77 |
| 2nd-order Gray-Edge(p=9, σ=3) |
3.95 |
2.95 |
3.21 |
1.08 |
8.34 |
19.00 |
| Bright Pixels (p=2, 5%) |
4.09 |
3.13 |
3.38 |
0.99 |
8.86 |
20.94 |
| Pixel-based Gamut(σ=10) |
11.27 |
10.99 |
11.11 |
4.44 |
18.39 |
23.61 |
| Edge-based Gamut(σ=9) |
12.17 |
11.64 |
12.01 |
4.54 |
19.45 |
24.10 |
| Intersection-based Gamut(σ=10) |
11.27 |
11.32 |
11.30 |
4.20 |
18.29 |
22.70 |
| Bayesian |
4.91 |
3.53 |
4.00 |
0.90 |
10.54 |
21.12 |
| Spatio-spectral (ML) |
3.80 |
2.99 |
3.11 |
0.99 |
7.97 |
17.70 |
| Spatio-spectral (GenPrior) |
3.59 |
2.89 |
2.96 |
0.86 |
7.61 |
16.96 |
| Natural Image Statistics |
4.36 |
3.51 |
3.84 |
1.27 |
8.53 |
16.25 |
* All other methods were executed/implemented based on the released source codes available online.
|
Timing Comparison:
Time for training and testing on the Canon EOS 1Ds Mark III dataset in minutes:
| METHOD |
TRAINING |
TESTING |
| Proposed |
- |
9.9 |
| Gray-World |
- |
7.8 |
| White-Patch |
- |
8.0 |
| Shades-of-Gray |
- |
14.6 |
| General Gray-World |
- |
27.3 |
| 1st-order Gray-Edge |
- |
29.5 |
| 2nd-order Gray-Edge |
- |
34.6 |
| Bright Pixels |
- |
13.6 |
| Pixel-based Gamut |
254 |
254 |
| Edge-based Gamut |
245 |
184 |
| Intersection-based Gamut |
251 |
235 |
| Bayesian |
32.2 |
2316.3 |
| Spatio-spectral (ML) |
133.2 |
168.3 |
| Spatio-spectral (GenPrior) |
126.9 |
61.7 |
| Natural Image Statistics |
453.2 |
25.2 |
|
Source Code:
Click here to download the source code of the proposed algorithm.
|
Acknowledgements:
This study was funded by Agency for Science, Technology and Research (grant No. 1121202020). We thank our photographer Mr. Looi Wenhe (Russell) for his hard work and effort in helping collect our dataset.
|
This page was last modified on: November 11, 2015